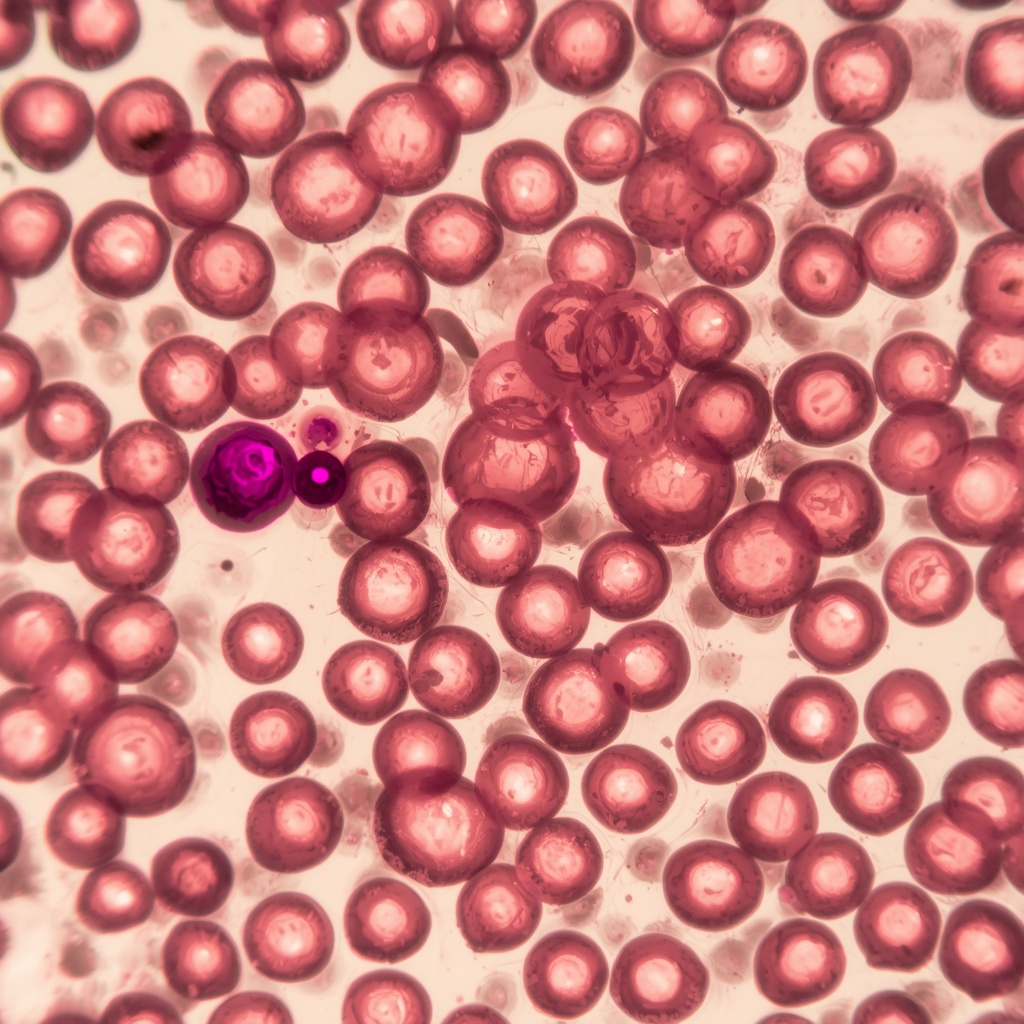
Counting parasites is the hard part.
Detecting malaria on a blood film is close to solved. Reporting how many parasites are there — the number that decides whether a case is severe — is not. MalariaX is building GPU-accelerated blood-film analysis that treats parasite density as the primary output.
Hero artwork slot
Routine microscopy reports far more malaria than is actually there.
When researchers re-read 335 slides from eleven public health facilities in Dar es Salaam, the laboratories had reported 53.1% of them as positive. Expert microscopists confirmed 2.1%.2
Sensitivity was 71.4% and specificity 47.3%, giving a positive predictive value of 2.8%. Ninety-three percent of the positive reports were recorded at the lowest possible density, one to five parasites per 200 white cells. Median reported density was 3 parasites per 200 WBC; expert median on genuinely positive slides was 1,226.
Detection is not the bottleneck any more
Machine-learning microscopes already match trained readers at finding parasites on a clean slide. The 2018–19 multi-country evaluation of EasyScan GO across eleven countries and 2,250 slides reached 91.1% sensitivity and 75.6% specificity against expert reference.3
Quantification still is
In that same study only 196 of 845 slides — 23% — produced a density estimate within ±25% of the reference count, and sensitivity fell to 57.1% below 200 parasites/µL. The device was graded WHO–TDR competence level 2 for detection but level 4 for quantification.3
| Measure | Routine lab microscopy | EasyScan GO (ML device) | What MalariaX targets |
|---|---|---|---|
| Sensitivity | 71.4%95% CI 35.9–91.8 | 91.1%95% CI 88.9–92.7 | ≥ expert level 1 |
| Specificity | 47.3%95% CI 41.9–52.7 | 75.6%85.1% on high-quality slides | ≥ 90% |
| Sensitivity below 200 p/µL | not reported | 57.1% | the primary research question |
| Density within ±25% of reference | not reported | 23%196 of 845 slides | the product |
| Study size | 335 slides, 11 facilities | 2,250 slides, 11 countries | stage 1, see below |
That last row is the whole thesis. A binary answer can be produced by a rapid diagnostic test for a fraction of the cost. The reason to put a slide under a microscope at all is the number, and the number is what everyone is currently getting wrong.
What happens to a slide
The system sits on top of the microscope a laboratory already owns. No proprietary hardware, no change to staining protocol, and a qualified reader signs every result.
Prepare and stain
Thick and thin films, Giemsa, exactly as the lab does today. We deliberately did not design around a proprietary consumable.
Scan fields
A camera on the existing 100× oil objective captures a defined number of fields. Field count is recorded because density arithmetic depends on it.
Reject bad images before analysing them
Blur, uneven illumination, stain precipitate and empty fields are caught here and the operator is asked to recapture. Silently analysing a bad film is how false positives are manufactured.
Detect and localise
A detector proposes parasite locations with a confidence score for each. Every proposal keeps its coordinates so a human can go back and look at it.
Count the denominator
Density is a ratio. A second model counts white cells on the thick film or red cells on the thin film, so parasites/µL is computed rather than estimated by eye.
A human decides
The reader sees every detection overlaid on the original field, with confidence and an interval on the density. They confirm, correct or reject. The system does not issue a result on its own.
Sign and export
A signed record with species, density, field count and the reader’s identity. Corrections are retained separately and only enter training data under an explicit agreement.
Real slides look nothing like a benchmark
Stain varies by bench
Giemsa pH, buffer age and staining time differ between labs and between technicians in the same lab. Colour shifts that a human ignores will move a model’s decision boundary.
Debris resembles parasites
Platelets over red cells, stain precipitate, bacteria and Howell-Jolly bodies all produce chromatin-like dots. This is the dominant source of false positives in both human and machine reading.
Density spans five orders of magnitude
From under 50 parasites/µL to over 500,000. A model tuned for the middle of that range fails at the two ends that matter clinically.
Optics are not standardised
Objective quality, condenser alignment, camera sensor and colour processing all differ. A model trained on one rig frequently does not transfer to another.
Species matters for treatment
Distinguishing P. falciparum from P. vivax, ovale and malariae changes what a clinician prescribes. Published external quality assessment in West Amhara found species misdiagnosis on 5.4% of slides — the single largest discordance category.4
The ground truth is itself imperfect
Expert reference counts vary between readers. WHO competency assessments grade microscopists on a four-level scale for exactly this reason, and pass rates for level 1 are frequently below half the cohort.5
Connectivity is intermittent
Many target sites have unreliable bandwidth. Whole-slide images are large, so the split between local and remote processing is a design constraint, not a deployment detail.
Where data goes, and where it stops
Two things in this diagram are deliberate: the quality gate can send work back before any model runs, and nothing reaches a patient record without passing through a person.
What we actually run on
Listed honestly: some of this is in daily use, some is on the plan for when there is production traffic to justify it. Items marked planned are not in use today.
NVIDIA
- CUDA
- The training and image-processing substrate. Everything in the detection and counting pipeline is written against it.
- cuDNN / PyTorch
- Model development for the detector and the cell counter, on A10G and L4 class GPUs.
- DALI
- Whole-slide tiles are large and the input pipeline, not the GPU, is usually the bottleneck. Decoding and augmentation move onto the device.
- TensorRT planned
- Inference optimisation once model architecture is frozen. Premature to do this while the detector is still changing weekly.
- Jetson Orin planned
- On-site inference for laboratories where uploading whole-slide images is not realistic. Depends on pilot connectivity data we do not have yet.
AWS
- S3
- Image and annotation storage, versioned, with object-level access logging. Region choice follows the data-residency terms of each source agreement.
- EC2 G5 / G6
- Spot instances for training runs. Cost discipline matters more than throughput at this stage.
- SageMaker
- Experiment tracking and evaluation jobs, so that every reported metric maps back to a specific commit and dataset split.
- IAM / CloudTrail
- Least-privilege roles and an audit trail. A requirement of the data agreements, not an aspiration.
- ECR + ECS planned
- Reproducible inference containers, once there is an external user to serve.
Four stages. We are on the first one.
Nothing below is a claim about performance. It is the sequence we intend to follow, and marking our position on it honestly is more useful to a prospective partner than a number we cannot defend.
Data and annotation
- Public datasets for baselines
- Annotation protocol with a parasitologist
- Inter-annotator agreement measured before any model claim
- Seeking slide sets from partner labs
Retrospective evaluation
- Held-out sets by site, not random split
- Density agreement as the headline metric
- Performance reported per density band
Multi-site robustness
- Different stains, scopes and cameras
- Between-site variance reported openly
- Failure cases published, not filtered
Prospective study
- Alongside routine workflow, not replacing it
- Pre-registered protocol
- Regulatory pathway confirmed per jurisdiction
What we train and test on
Public malaria microscopy data is small, narrow and mostly P. falciparum. Being specific about that is part of the point.
| Dataset | Contents | Known limitation for our purpose |
|---|---|---|
| NIH / NLM thin smear6 | 27,558 segmented cells13,779 parasitised, 13,779 clean | Pre-segmented single cells from 150 P. falciparum patients in Bangladesh. Useful for classification, useless for density, since the field context is gone. |
| BBBC0417 | 1,328 images~80,000 cells | Whole fields with expert annotations, which is what density work needs. Small, and single-source. |
| MP-IDB8 | 4 speciesfalciparum, vivax, ovale, malariae | The only public set with meaningful non-falciparum representation. Too small to train species classification on alone. |
None of these were collected on the equipment our target laboratories use, and none carry thick-film density references. Closing that gap is the reason the pilot programme exists, and it is the main thing we need from partners.
Where the model is not allowed to decide
A person signs, always
No result leaves the system without a qualified reader confirming it. This is a hard constraint in the software, not a workflow recommendation. If a laboratory wants an unattended mode, we are not the right supplier.
Uncertainty is shown, not smoothed
Low-confidence detections and wide density intervals are surfaced prominently. A system that hides its doubt trains its users to stop checking, which is the failure mode that makes assistive AI dangerous.
Performance is reported by subgroup
Aggregate accuracy hides the cases that matter. Metrics are broken out by density band, species, stain quality and site. If the system is worse at low parasitaemia, that belongs in the report, not the appendix.
Corrections stay separate from training data
Reader corrections are stored and can be audited, but they only enter a training set under an explicit data agreement with the institution. Silent learning from clinical use is not something we do.
Research performance is not clinical performance
Until a prospective study is complete and the relevant regulator has been engaged, any number we publish is a research finding. We will say so every time, including when it is inconvenient.
Vision first, and for a long time
Three further products are on the plan. They depend entirely on the first one working and on having governed data from real deployments, so what follows is a statement of intent, with no dates attached.
Forecast
Transmission-risk estimates from verified diagnostic counts combined with rainfall, temperature and land use. Needs a deployed base of sites reporting density before it means anything.
Genome
Drug-resistance marker surveillance. This requires sequencing partners and an ethics framework we do not have, and it is a research collaboration rather than a product.
Command
A programme-level view for ministries and malaria control programmes, aggregating across sites. Only meaningful once enough laboratories are running Vision to make the aggregate representative.
Sell to laboratories, not to health systems
Ministry procurement cycles are long and evidence-hungry, and rightly so. Private diagnostic laboratories and research groups can adopt on a shorter timescale, and they are the ones who feel the cost of a re-read.
First
Private diagnostic laboratories
High slide volume, direct cost pressure, no procurement committee.
Research groups and trials
Need defensible, auditable density counts and already work to a protocol.
Teaching hospital laboratories
Have the reference expertise to validate against, and an interest in training.
Only after evidence
National malaria control programmes
Require prospective data and a regulatory position before any serious conversation.
Hospital and laboratory groups
Multi-site licensing, once single-site deployment is proven and supportable.
Global health organisations
Surveillance value only exists at a coverage level we are nowhere near.
How it would be paid for
Per-site subscription banded by slide volume, with a research tier priced at cost for validation partners. We have not tested willingness to pay, so treat these as hypotheses. Anyone who quotes you a confident price for a product with no clinical data is selling you something else.
The people building it
Computer vision, laboratory parasitology, and the engineering that sits between them.

Mark Kieni
Data partnerships, pilot recruitment and fundraising. Most of the job is getting slide sets released to us.

Sharon Akoth
Builds the detection and counting models, and the training pipeline they run on. Owns the path from image intake through to a density estimate.
Henry Korben
Reference reader. Sets the annotation protocol, and adjudicates every disagreement between the model and a slide.
Tell us which conversation this is
Pilot sites and parasitologists get answered first, because that is what we are short of. Everything else within a few working days.
Pilot sites and laboratories
Slide sets, protocol questions, or hosting an evaluation.
pilots@malariax.comResearch and data sharing
Annotation protocols, dataset access, co-authorship.
research@malariax.comIncluding the awkward ones
No. We are at stage 1: assembling data and fixing the annotation protocol. Every performance figure on this site is from published work by other groups and is cited. When we have our own numbers we will publish the protocol and the failure cases with them.
For a yes-or-no answer you should. RDTs are cheaper, faster and do not need a trained reader. Microscopy exists because it gives species and parasite density, which RDTs do not, and density is what determines whether a case is treated as severe. That is the part we are working on.
Detection largely is. The 2022 multi-country evaluation reached 91.1% sensitivity, which is genuinely good. Quantification is not: 23% of density estimates landed within ±25% of the reference count, and the device was graded WHO–TDR level 4 on quantification accuracy. It also requires buying their scanner. We are targeting the quantification gap on hardware laboratories already own.
No, and the software will not let you. A qualified reader has to sign every result. Where microscopists are scarce the useful thing is to make each one faster and more consistent, not to remove them from a decision that carries clinical risk.
None. We have not applied. The intended-use statement has to be settled first, and it determines which pathway applies and in which country. Hiring an advisor for this is on the list above.
Annotated slide sets from laboratories in endemic settings, with thick-film density references, and a parasitologist willing to act as reference reader. Funding matters, but data is the binding constraint.
Every figure on this page
1. World Health Organization. World malaria report 2025, published 4 December 2025. 282 million cases and 610,000 deaths estimated for 2024 across 80 endemic countries. who.int
2. Kahama-Maro J, D’Acremont V, Mtasiwa D, Genton B, Lengeler C. Low quality of routine microscopy for malaria at different levels of the health system in Dar es Salaam. Malaria Journal 2011;10:332. PMC3217957
3. Das D, Vongpromek R, Assawariyathipat T, et al. Field evaluation of the diagnostic performance of EasyScan GO: a digital malaria microscopy device based on machine-learning. Malaria Journal 2022;21:122. PMC9004086
4. Mitiku H, et al. External quality assessment of malaria microscopy diagnosis among public health facilities in West Amhara Region, Ethiopia. 6,689 slides cross-checked; 8.12% discordant, 5.4% species misdiagnosis. PMC5740603
5. Analysis of the WHO External Competency Assessment of Malaria Microscopists (ECAMM). Malaria Journal 2019;18:359. Competency graded on a four-level scale; level 1 certification rates commonly fall below half of each cohort. malariajournal.biomedcentral.com
6. Rajaraman S, Antani SK, Poostchi M, et al. Pre-trained convolutional neural networks as feature extractors toward improved malaria parasite detection in thin blood smear images. PeerJ 2018;6:e4568. Dataset of 27,558 segmented cell images. dataset catalogue
7. Broad Bioimage Benchmark Collection, BBBC041: malaria-infected human blood smears, 1,328 images. bbbc.broadinstitute.org/BBBC041
8. Loddo A, Di Ruberto C, Kocher M, Prod’Hom G. MP-IDB: The Malaria Parasite Image Database for Image Processing and Analysis. neuroimaging.it